

Reading between and across the lines
A sharing on story analysis for Social Design
As Hong Kong’s first multidisciplinary and participatory social design platform to innovate public services, the Jockey Club Make a Difference (MaD) Social Lab has come to the third round this March with the Healthy Street Lab, following the LIBoratory Project and the Park Lab. In the three labs addressing public library services, park and road design, intensive fieldwork was conducted in respective communities to collect intelligence from community stakeholders (in which local residents played a significant part) as well as to observe the current facility and service infrastructures.
Analysing useful insights from the vast amount of collected stories has often emerged as a laborious and challenging task. It could be daunting for one to read between the lines and probe into potentially intriguing snippets on one’s own, not to mention iterating the process and exchanging such findings as a group.
Having partnered with social innovation agent Kennisland (The Netherlands) and design
educators from the Hong Kong Polytechnic University on the design process of the first two labs, the MaD team integrated the experiences and strengths of both approaches and developed its own story analysis workflow for the Healthy Street Lab, which ran efficiently and effectively.
In an attempt to supply the research perspective to, and clarify conceptual or principle issues in the story analysis method in the context of social design, Johnson Au (Park Lab fellow and Consultant at the HKSAR Efficiency Unit) and I facilitated a workshop with lab alumni and the MaD team, in the kind presence of Dr Terry Leung (Founder and Chairperson of the Institute for User Participation), on 24 June 2018 to share alternative analysis tools that have been proven helpful and to talk through the difficulties in its process by analysing a sample story together.
What are we actually doing as we analyse?
The word analysis, deriving from ancient Greek, means breaking things down. We are breaking the stories down into snippets that deserve our closer attention. These details are noteworthy because they tell us something we don’t already know, or they suggest an uncommon association, or they contradict with something else (in the same or across other materials).
After breaking the stories down, our next step is to synthesise the bits, reorganising or categorising the discrete snippets by criteria that carry us forward to generate design ideas. The latter is essentially a process of interpretation and subjective judgement, as the analyst’s own prior background and knowledge, point of view and biases will all inform his/her interpretation of the material.

In what ways can we break stories down?
The five analysis tools we introduce may help us disentangle the complexities in each story and present the snippets systematically. It should nevertheless be noted that each tool is itself a simplified form focussing only on a specific aspect of the material to be analysed, and thus its outcomes should not be taken as a sole or holistic view. It is advised that analysts select or combine the tool(s) deemed relevant with regards to analysis goals and the nature of the materials under study.
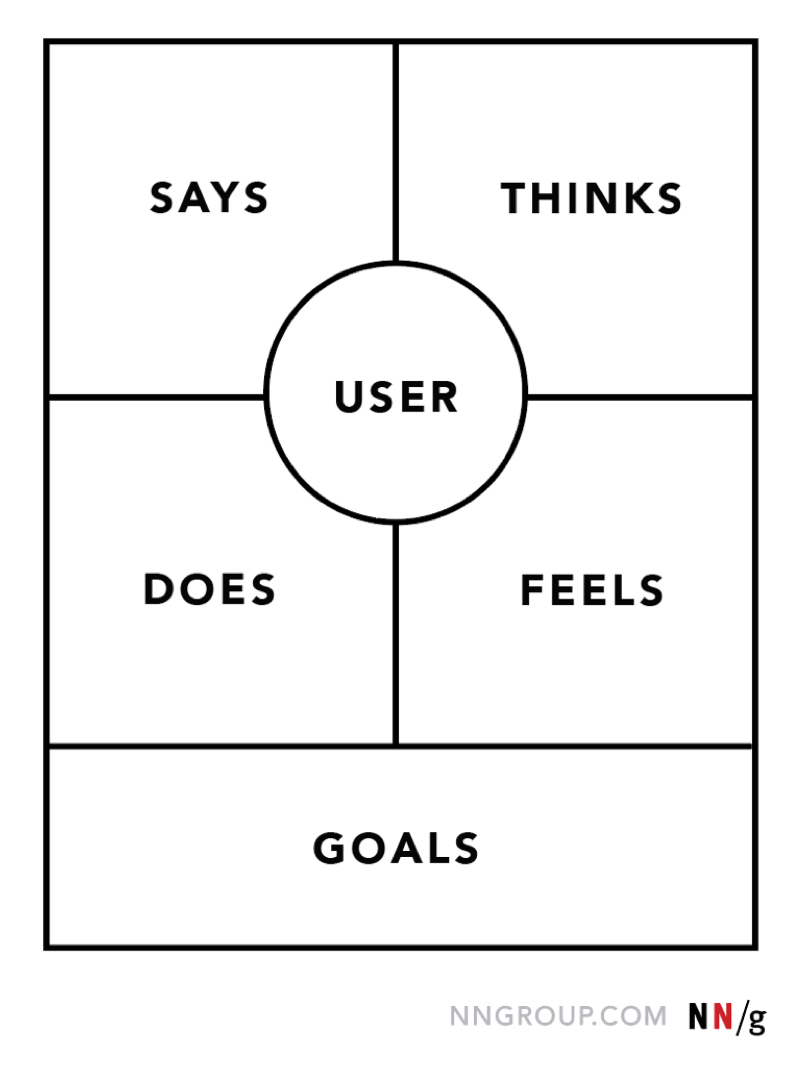
Empathy Map
There are different versions of the empathy map. Below is the one we used at the workshop. It focusses on an individual’s observable and latent dimensions: what one says, does, thinks and feels. The gaps to be identified can thus be discrepancies across quadrants horizontally (between say/do and think/feel) or vertically (between say/think and do/feel). We often encounter protagonists in stories who are confused about or unsure of their needs, or even inconsistent in their words/actions and thoughts/beliefs. Sometimes such gap may be intentional — the interviewee is deliberately conveying a certain impression of himself/herself. This tool can help us, as analysts, clarify the protagonist’s line of thinking and whether or how they have acted upon their desires.
In the workshop, we tried analysing a story from the Healthy Street Lab with the empathy map. The writers of this story (intentionally or unintentionally) frame the interviewee (DoDo)’s perspective with modifiers such as “she thinks” and “she feels”, in addition to direct and indirect quotes, making it a good sample for this tool. We completed the maps in groups and shared our classification for each quadrant.
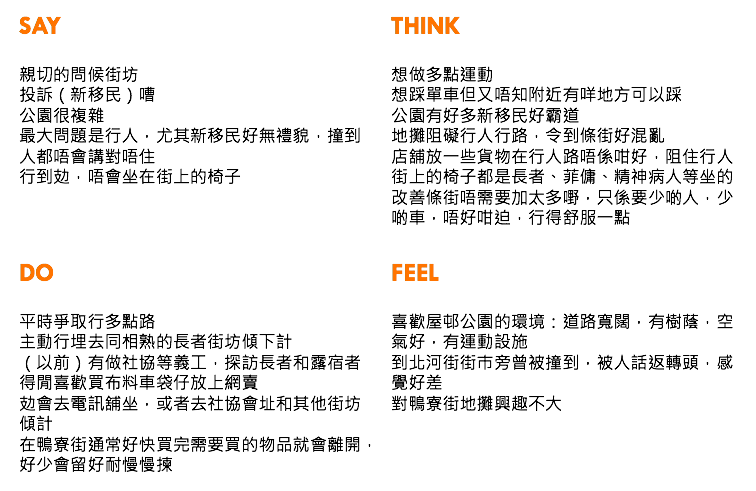
Unsurprisingly, differing views arose as to whether a certain piece of evidence falls into “think” or “feel”. One way to resolve this can be differentiating between rational and affective evidence. The treatment of “say” is also ambiguous as everything the interviewee said reflected her thoughts and feelings. We may, by virtue of representing the interviewee in a more authentic way, put direct and exact quotes in the “say” quadrant, and everything else that can be inferred from what he/she said, including what he/she expressly declares as a thought or feeling, into the “think” or “feel” quadrants as appropriate.
Journey Map
Apart from analysing and identifying inconsistencies within an individual, there are also tools that help us make sense of data collected over time and along a moving locus. The journey map (#6 in the above diagram) can put us in perspective in this case. It can come in especially handy for analysing stories of the Healthy Street Lab as the stories centre on the walking experience. When we represent all journeys graphically on an actual map, we can annotate each one with our notes of field and user observation (#3–5), as well as opportunities identified (#7).
Identifying Disconnects
This table of various disconnects that can be found in stories provided by Kennisland can be viewed as an extension of the gaps in the empathy map (i.e. the empathy map illustrating “disconnects between my current situation and my wishes” in the leftmost column above). While the empathy map may expose gaps within the individual that he/she is unaware of, the disconnects between ideals and reality in this table can also include gaps that the individual is conscious of (and thus feels frustrated or powerless about). For example, the interviewee in Amsteldorp wants to be independent but is aware of the constraint that he/she requires care as well (second quote).
We also covered examples of disconnects between the individual and the organisation, as well as between organisations, which are more common among public institutions in Hong Kong. The former usually arises out of professionalisation and specialisation where experts and decision makers lose touch with the perspective and experience of ordinary users; while the latter may be due to unnecessary structures between organisations that complicate or delay problem solving.
KJ Method
The KJ Method is basically about breaking down stories into snippets or concepts on sticky notes and arranging them in various ways to find patterns. The key here is to encourage regrouping and not to settle on the first attempt of categorisation, as the convenient and apparent view is most of the time not the best-informed one. If a group tends to settle on the first classification, the facilitator may stimulate thinking by challenging a certain concept in its place and suggesting alternative criteria for regrouping.
The degree of critical engagement in this exercise depends largely on the level of trust and power distance among participants. If a certain classification is suggested by a figure of authority, the rest of the group may tend not to question the status quo by proposing otherwise. It is therefore crucial for the facilitator to highlight the open-endedness of each grouping and encourage inputs from everyone in order to refine the analysis.
Stakeholder Map and Metrics
Differentiating the roles of various stakeholders in the issue is important in story analysis as we can then determine what to do with their inputs (or the lack thereof). The stakeholder map and metrics can be useful for defining the interests (convictions), powers and responsibilities of each stakeholder and devising strategies to engage them effectively. The stakeholder metrics is particularly helpful when we evaluate the relative significance of various stakeholders and seek to balance their interests.
In light of the stakeholder metrics, parties with high influence (power) and high stake (interest) are in the highest priority and to be managed closely. Parties with high influence but low stake are key. One may either be passive towards them (keep them satisfied) or actively try to involve them in the issue (make them interested and increase their stake). Parties with low influence but high stake should at least be kept informed even though their power is limited, and one may try to involve them in the issue by empowering them. In the context of social design, the goal is to enlarge the pool of stakeholders that are both high in influence and stake, bringing parties with imbalanced influence and stake into the game.
Stakeholders in different quadrants influence one another. When analysing stakeholders with this metrics, one must therefore evaluate the interconnected power dynamics between them. For example, candidates in an election may try to win the hearts of voters by acting on issues that please them, and voters’ impression of their representatives can also be influenced by myriad factors (albeit irrelevant to capability).
How do we synthesise these data into insights?
Once we boil down a story to its elements, we need to make sense of them as a situation. What things are related to each other, and in what ways? It involves hierarchical and analogous thinking—generalising the broader principle or logic behind the subsets or examples. If we are exposing inconsistencies in the previous step of breaking stories down, now we are trying to bring everything to consistency again, which is achieved by a strong connection between evidence and our generalisation. Our explanation or interpretation of the data should not contradict with what the interviewee provides us.
This applies to analysis on the levels of a single story as well as a set of stories; each interviewee can be analysed on its own with solutions specific to him/her, and all interviewees (if representative enough) can also be analysed to generate solutions for the community at large. In the case of DoDo’s story we analysed above, we may draw these conclusions:
- She wants to work out (she wants to bike but doesn’t know where she can do that in the neighbourhood; walking is a compromised way of achieving the same goal). This is also reflected in her liking of the neighbourhood park that has facilities for exercise (in addition to a pleasant ambience such as fresh air and canopy) despite her negative comment of the presence of people she deems unwelcome there. This leads us to the second conclusion.
- She dislikes sharing space with people she feels unwelcome. Her criticism of new immigrants can be read analogously with her aversion to other such marginalised groups as domestic helpers, the elderly and “the mentally ill” that she believes are occupying the chairs on the streetside. She avoids encounters with them (not sitting on streetside chairs and opting to sit in telecom shops or the community centre instead), and gets irritated when conflict arises (an unfriendly new immigrant pedestrian bumps into her without apology).
Every analyst interprets and synthesises differently. It is crucial at this stage to share our own findings and insights, bringing subjectivities together the closest we can to what Dr Leung called communicative rationality or intersubjectivity — a state of near-objectivity by way of talking things through.
What insights are significant?
Once we lay out our possible interpretations of the story’s details, we may get distracted by the wide-ranging issues to tackle. How do we determine their significance and our priorities? If we pursue the most cited issue(s) across stories, we may result in prototypes that serve the interests of the majority, leaving the outliers, whose views are not any less valid, unaddressed. Is the more always the better?
We may also come up with insights that are applicable to a variety of contexts as well as to the specific context under study. The advantage of the former is that the prototype idea will be replicable with higher demonstrative power, but the latter will lead to more focussed and grounded prototypes that users are more likely to relate to. Shall we go big or small then?
To address these questions, we have to take into account the cases from all stakeholders (is one party already working on this issue, so the gap is a result of lack of knowledge or miscommunication?) and our design goal (if one issue often comes up, shall we address the symptoms or the mindset behind it?). Equally important is how accurately the insight may be reflected in a prototype, which is what the story collection and analysis process for social design is driven towards. Some issues may not require a prototyped solution, and can be mitigated by enhancing existing products or services.
How do insights inform prototypes?
Once we have analysed the stories we collected and extracted the insights, the next step is to generate prototypes that stimulate people to imagine or practise alternatives. They should be designed in a way that is grounded upon the insight drawn from the story, and the more specific to the user’s experience, the better.
In DoDo’s case, is her underuse (or her perceived abuse by others) of chairs an issue in the context of a social experiment promoting walkability and healthy street environments? If we shift the focus from the chairs she avoids (a sedentary state) to her desires (exercise and movement), we may derive a prototype idea of advocating walking as a (social or community) sport. If we focus on her perceptions of people she shares space with, we may come up with something that facilitates people to walk together as a way to understand one another and promote dialogue.
In the workshop, we discussed how we may derive prototype ideas for broad concepts like sharing space. We need to boil down the general theme to design a measurable task with actionable criteria. The theme of sharing space, for example, can be narrowed down to:
- (Task) A trolley user getting across a street section
- (Criteria) Safely (without hurting oneself and others) and without blockage.
The analyst as anthropologist and designer
Story analysis is a process of drawing and articulating connections, across the experiences of different users, between proximate or visceral experience or feeling and cognitive awareness. The analyst’s role is to bring the latter to light and gatekeep a strong linkage between prototypes and stories. The work here deals mainly with texts, perhaps occasionally also photographs, sound recordings and videos, but the method is one of anthropology and the thinking is one of design. Analysis flips a told actual experience into a hypothetical reality of what could have been, constructing, or designing the situation where prototypes can intervene.
At the time of completing this recap, the Healthy Street Lab has already come to a close. While it takes time for the learnings of the cross-sector experiment to infiltrate across levels and for any successive projects to take root, stories keep growing out of communities, the field of urban everyday life, and we must always keep our ears open to refine our understanding of the issue in question.
________________________________________________________________